Japan Gold Intersects High-Grade Silver Mineralization at the Saroma Prospect
Vancouver, British Columbia--(Newsfile Corp. - December 14, 2022) - Japan Gold Corp. (TSXV: JG) (OTCQB: JGLDF) ("Japan Gold" or the "Company") is pleased to announce drilling at the Saroma prospect has encountered multiple intersections of high-grade silver with gold mineralization along a 1 km length of the Saroma vein. The Saroma vein forms part of a larger, 3.5 km long open-ended district-scale mineralized structure which hosts the Saroma, Chitose and Taiho historical workings, collectively called the Saroma prospect. Saroma is one of several prospects the Company is advancing within its 100% owned Ikutahara Project in Hokkaido, Japan.
Highlights:
High-grade silver with gold mineralized intervals include:
- IKDD22-012
1.05 m @ 1.3 g/t Au & 1,449.5 g/t Ag (19.0 AuEq) from 90.55 m
(incl. 0.4 m @ 3.2 g/t Au & 3,570.0 g/t Ag (46.7 AuEq) from 90.8 m)
- IKDD22-010
3.1m @ 0.4 g/t Au & 475.7 g/t Ag (6.2 AuEq) from 104.75 m
(incl. 1.0 m @ 0.6 g/t Au & 1,128.8 g/t Ag (14.3 AuEq) from 105.5 m)
- IKDD22-009
4.1m @ 0.7 g/t Au & 124.8 g/t Ag (2.2 AuEq) from 55.65 m
(Incl. 0.75m @ 2.7 g/t Au & 425.0 g/t Ag (7.9 AuEq) from 56.25 m)
(Refer to Table 1 for more detailed assay data).
- All six drill holes intersected significant quartz vein zones up to 8 m wide proving continuity of a robust vein hosting structure along a 1 km section of the Saroma vein.
- Vein intervals show a range of textures including colloform-crustiform-ginguro banding with overprinting vein breccia events indicating a dynamic multi-phase hydrothermal system.
- Quartz textures are predominantly chalcedonic with lesser crystalline phases indicating the system is well preserved and open to depth below the shallowly developed workings.
- Detailed mapping has confirmed multiple vein zones with broad silicification envelopes along a 3.5 km long mineralized corridor which hosts the Saroma, Chitose and Taiho historical workings.
- The Saroma prospect structure remains open an additional 5 km southwest towards the historical Jomon mine workings where numerous quartz boulders sampled in a small open pit reported grades averaging 25 g/t gold and 50 g/t silver.
"The confirmation of wide coherent chalcedony-rich veins, and high-grade silver with gold intersections along an open-ended district-scale structure are very encouraging outcomes from the initial drill program at Saroma. Both gold and silver biased mineralization events are seen in adjacent prospects including Showa, Ikutahara, and Taihoku, and along the same structure 5 km to the SW at the under-explored Jomon workings. It is assumed the same gold rich events occur at the Saroma prospect based on historical production data. Large epithermal vein deposits require large fluid pathways which is what we are seeing in the cretaceous basement host rocks at Saroma. Typically, not all the quartz in such extensive vein systems is well mineralized and next year's programs will target gold-rich shoots via staged soil sampling and geophysics to rapidly commence additional drilling," commented Andrew Rowe, Japan Gold's VP of Exploration.
Drilling Summary & Findings
The 1.2 km long vein at Saroma is located at the northeast end of an open-ended 3.5 km long mineralized structure which includes the Saroma, Chitose and Taiho mine workings, Figures 1, 2 & 3. Between July and September this year, 6 diamond drillholes were completed along a 1 km long section of the Saroma vein for a total of 1,309 m, Table 2.
Drilling has advanced the understanding of structural controls, alteration zonation and minerology at Saroma. Saroma comprises multiple veins within a large continuous structure, which were successfully intercepted in all six drillholes along a 1 km strike length, and to a depth 130m below surface, Figure 4 & 5. Importantly, vein widths up to 8 meters (true width) have been intersected with high-grade silver, and gold mineralization. Quartz veining exhibits impressive chalcedony-rich low-sulphidation epithermal vein textures, indicating good preservation of the vein system. Wide coherent veins intercepted in the southwestern holes: IKDD22-009; 010; 012 and 013 show an average true width of 7.0 m. In the two north-eastern drill holes IKDD22-011 and 014, more dispersed zones of sheeted and stockwork veining up to 21 m in down hole length were encountered with individual veins up to 2 m in down-hole width. This splaying of veins in the northeast is potentially indicative of a step-structure where the host structure is stepping over to coalesce into a more coherent structure further along strike. Silicification at surface to the north may support this potential extension at depth.
Quartz veins at Saroma show a diverse range of low-sulfidation epithermal textures, brecciation and minerology suggesting a dynamic system with multiple fluid phases amenable to gold deposition, Figures 6a & b. High level chalcedony-rich vein textures are observed in the deepest holes IKDD22-10 and IKDD22-13 indicating that the current drill intercepts are within the mineralization window and further drill testing down dip is warranted. Vein textures and the geometry of higher-grade mineralization identified along the Saroma vein trend may be indicative of a southwest plunge to mineralization towards the Chitose and Taiho prospects 500 and 1,500 m to the southwest. Reconnaissance mapping along the Saroma structure in 2016 by the Company found surface rock samples up to 10.85 g/t gold and 136 g/t silver. Recent detailed mapping has confirmed veining with broad silicification envelopes at Chitose and Taiho and banded chalcedony veins outcrops up to 5 m wide at the latter.
The historical Jomon workings are located another 5 km southwest of the Taiho workings on what appears to be the continuation of the Saroma structure, Figure 3. Information on mining here is limited but sampling of numerous quartz boulders in a small open pit report grades averaging 25 g/t gold and 50 g/t silver1. In 1933 an underground cross-cut was excavated to locate the source of the boulders but results are unknown.
Forward Plans
2023 work programs will aim to delineate high-grade gold and silver shoots along the Saroma structure and towards the Jomon workings. Staged work programs will include detailed mapping with soil sampling to identify precious and path-finder element anomalies for focussed CSAMT geophysical surveying. Targets developed by this work will be ranked to guide drilling.
Saroma Prospect
Located approximately 4 km south of the Kitano-o gold mine, the historic Saroma, Taiho and Chitose gold workings were developed on epithermal veins that step along a northeast trending fault zone which extends for at least 3.5 km along the Saroma valley, Figures 1-3. Operated during the 1930's, records show the Saroma mine produced 13,189 tons of ore at an average grade of 9.7 g/t gold between 1933 to 19392. There are no production records from the Taiho and Chitose workings, however, exploration and mining was reported from these latter two areas immediately prior to the 1943 gold mining moratorium.
Table 1 Significant mineralized intercepts for IKDD22-009 to IKDD22-014 based on down-hole lengths
| Drill Hole Number | From (m) | To (m) | Length (m) | Au g/t | Ag g/t | Au Eq g/t | Structure |
| IKDD22-09 | 31.7 | 32.05 | 0.35 | 0.5 | 14.6 | 0.7 | Hanging wall splay |
| 55.65 | 59.75 | 4.1 | 0.7 | 124.8 | 2.2 | Saroma Main Vein | |
| Incl. | 55.65 | 57.00 | 1.35 | 1.7 | 302.4 | 5.4 | Saroma Main Vein |
| 56.25 | 57.00 | 0.75 | 2.7 | 425 | 7.9 | Saroma Main Vein | |
| IKDD22-10 | 41.65 | 42.0 | 0.35 | 0.2 | 7.37 | 0.3 | Hanging wall splay |
| 98.75 | 100.35 | 1.6 | 1.2 | 56.5 | 1.9 | Saroma Main Vein | |
| Incl. | 99.4 | 100.15 | 0.75 | 2.1 | 88.8 | 3.2 | Saroma Main Vein |
| 104.75 | 107.85 | 3.1 | 0.4 | 475.7 | 6.2 | Saroma Main Vein | |
| Incl. | 104.75 | 106.5 | 1.75 | 0.6 | 833.8 | 10.7 | Saroma Main Vein |
| 105.5 | 106.5 | 1.0 | 0.6 | 1,128.8 | 14.3 | Saroma Main Vein | |
| IKDD22-11 | 121.55 | 122.05 | 0.5 | 0.2 | 150.4 | 2.0 | Saroma Main Vein |
| Incl. | 121.8 | 122.05 | 0.25 | 0.3 | 234.0 | 3.1 | Saroma Main Vein |
| 147.6 | 148.8 | 1.2 | 0.5 | 25.9 | 0.8 | Saroma footwall | |
| IKDD22-12 | 88.9 | 89.3 | 0.4 | 2.4 | 37.9 | 2.9 | Saroma Main Vein |
| 90.55 | 91.6 | 1.05 | 1.3 | 1,449.5 | 19.0 | Saroma Main Vein | |
| Incl. | 90.8 | 91.2 | 0.4 | 3.2 | 3,570.0 | 46.7 | Saroma Main Vein |
| IKDD22-13 | 46.15 | 46.6 | 0.45 | 0.4 | 1.2 | 0.4 | Hanging wall splay |
| 120.85 | 123.4 | 2.55 | 0.5 | 6.0 | 0.6 | Saroma Main Vein | |
| Incl. | 123.1 | 123.4 | 0.3 | 1.0 | 2.1 | 1.1 | Saroma Main Vein |
| IKDD22-14 | 94.55 | 94.90 | 0.35 | 0.2 | 1.0 | 0.2 | Saroma Main Vein |
| 143.85 | 144.30 | 0.45 | 0.2 | 4.0 | 0.2 | Saroma footwall |
Gold equivalent (AuEq) = (Ag g/t / 82.4) + Au g/t. This calculation was based on an average of gold and silver prices for the month of November 2022.
Table 2: Saroma prospect drill hole data
| Hole ID | Azimuth (true north) | Dip | Collar Easting | Collar Northing | Elevation (m) | Length (m) |
| IKDD22-09 | 305 | -50 | 709060 | 4862202 | 255.0 | 324.4 |
| IKDD22-10 | 305 | -75 | 709060 | 4862202 | 255.0 | 158.1 |
| IKDD22-11 | 285 | -50 | 709594 | 4862731 | 225.5 | 313.0 |
| IKDD22-12 | 310 | -50 | 709185 | 4862303 | 254.0 | 162.4 |
| IKDD22-13 | 310 | -68 | 709185 | 4862303 | 254.0 | 150.9 |
| IKDD22-14 | 285 | -45 | 709682 | 4862873 | 219.7 | 200.0 |
| Total 1,308.8 | ||||||
References:
1Gold Mines of Japan, 1989. The Mining & Materials Processing Institute of Japan.
2Metal Mining Agency of Japan, March 1990, Geological Survey Report for Fiscal Year 1989, Northern Hokkaido Area B - Metalliferous Deposits Overview. Japan, Resource Geology, 46(3), pp 151-166.
On behalf of the Board of Japan Gold Corp.
"John Proust"
Chairman & CEO
Qualified Person
The technical information in this news release has been reviewed and approved by Japan Gold Vice President of Exploration, Andrew Rowe, BAppSc, FAusIMM, FSEG, who is a Qualified Person as defined by National Instrument 43-101.
Sampling Techniques and Assaying
The drilling results discussed in this news release are from drill core samples obtained by PQ, HQ and NQ-size triple-tube diamond core drilling using a PMC700 and PMC-400 man-portable drill rigs owned and operated by the Company. The drilling program was fully supervised by Company senior geologists at the drilling site.
Drill core was collected in plastic core-trays at the drill site and transported by road in Company vehicles to its core shed storage facility in the nearby Ikutahara Village, located centrally within the project area. The drill core was carefully logged, photographed and sample intervals marked-up along predicted mineralized and selected unmineralized intervals by Japan Gold KK senior project geologists.
Sample lengths varied from 0.15 to 1.0 m; depending on the positions of geological contacts and variations in vein texture and composition. The core was split by diamond rock saw supervised by project geologists. Half-core sample was collected from the entire length of each designated sample interval and placed into individual-labelled, self-sealing calico bags for secure packaging and transport to the laboratory. The half-core samples weighed between 0.25 to 5 kg depending on the sample length and core size. A Chain-of-Custody was established between the Company and receiving laboratory to ensure the integrity of the samples during transportation from site to the lab. The samples were sent in batches to ALS Laboratories in Vancouver, Canada for sample preparation and assaying.
Samples were crushed, pulverised and assayed for gold 50 g charge Fire Assay / AAS Finish (Au-AA24; 0.005 ppm lower detection limit) and a 48 multi-element by 4-acid digest with ICP-MS determination (ME-MS61L; Ag 0.002 ppm lower detection limit). Over-limit Au and Ag samples were re-assayed by fire-assay and gravimetric finish (GRA-22, LDL of 0.5 and 5 ppm for Au and Ag respectively).
Certified Reference Materials (CRMs) were inserted by Japan Gold KK at every 20th sample to assess repeatability and assaying precision of the laboratory. In addition, the laboratory applied its own internal Quality Control procedure that includes sample duplicates, blanks & geochemical standards. They report these results with the certified Assay Report. Laboratory procedures and QAQC protocols adopted are considered appropriate. The CRMs and internal QC-QA results fall within acceptable levels of accuracy & precision and are considered to lack any bias.
About Japan Gold Corp.
Japan Gold Corp. is a Canadian mineral exploration company focused solely on gold exploration across the three largest islands of Japan: Hokkaido, Honshu and Kyushu. The Company has a country-wide alliance with Barrick Gold Corporation to jointly explore, develop and mine certain gold mineral properties and mining projects. The Company holds a portfolio of 31 gold projects which cover areas with known gold occurrences, a history of mining and are prospective for high-grade epithermal gold mineralization. Japan Gold's leadership team represent decades of resource industry and business experience, and the Company has an operational team of geologists, drillers and technical advisors with experience exploring and operating in Japan. More information is available at www.japangold.com or by email at This email address is being protected from spambots. You need JavaScript enabled to view it.
For further information please contact:
John Proust
Chairman & CEO
Phone: 778-725-1491
Email: This email address is being protected from spambots. You need JavaScript enabled to view it.
Website: www.japangold.com
Cautionary Note
Neither the TSX Venture Exchange nor its Regulation Services Provider (as such term is defined in the policies of the TSX Venture Exchange) accepts responsibility for the adequacy or accuracy of this release. This news release contains forward-looking statements relating to expected or anticipated future events and anticipated results related to future partnerships and the Company's 2021 and 2022 gold exploration program. These statements are forward-looking in nature and, as a result, are subject to certain risks and uncertainties that include, but are not limited to, general economic, market and business conditions; competition for qualified staff; the regulatory process and actions; technical issues; new legislation; potential delays or changes in plans; working in a new political jurisdiction; results of exploration; the timing and granting of prospecting rights; the Company's ability to execute and implement future plans, arrange or conclude a joint-venture or partnership; and the occurrence of unexpected events. Actual results achieved may differ from the information provided herein and, consequently, readers are advised not to place undue reliance on forward-looking information. The forward-looking information contained herein speaks only as of the date of this News Release. The Company disclaims any intention or obligation to update or revise forward‐looking information or to explain any material difference between such and subsequent actual events, except as required by applicable laws.
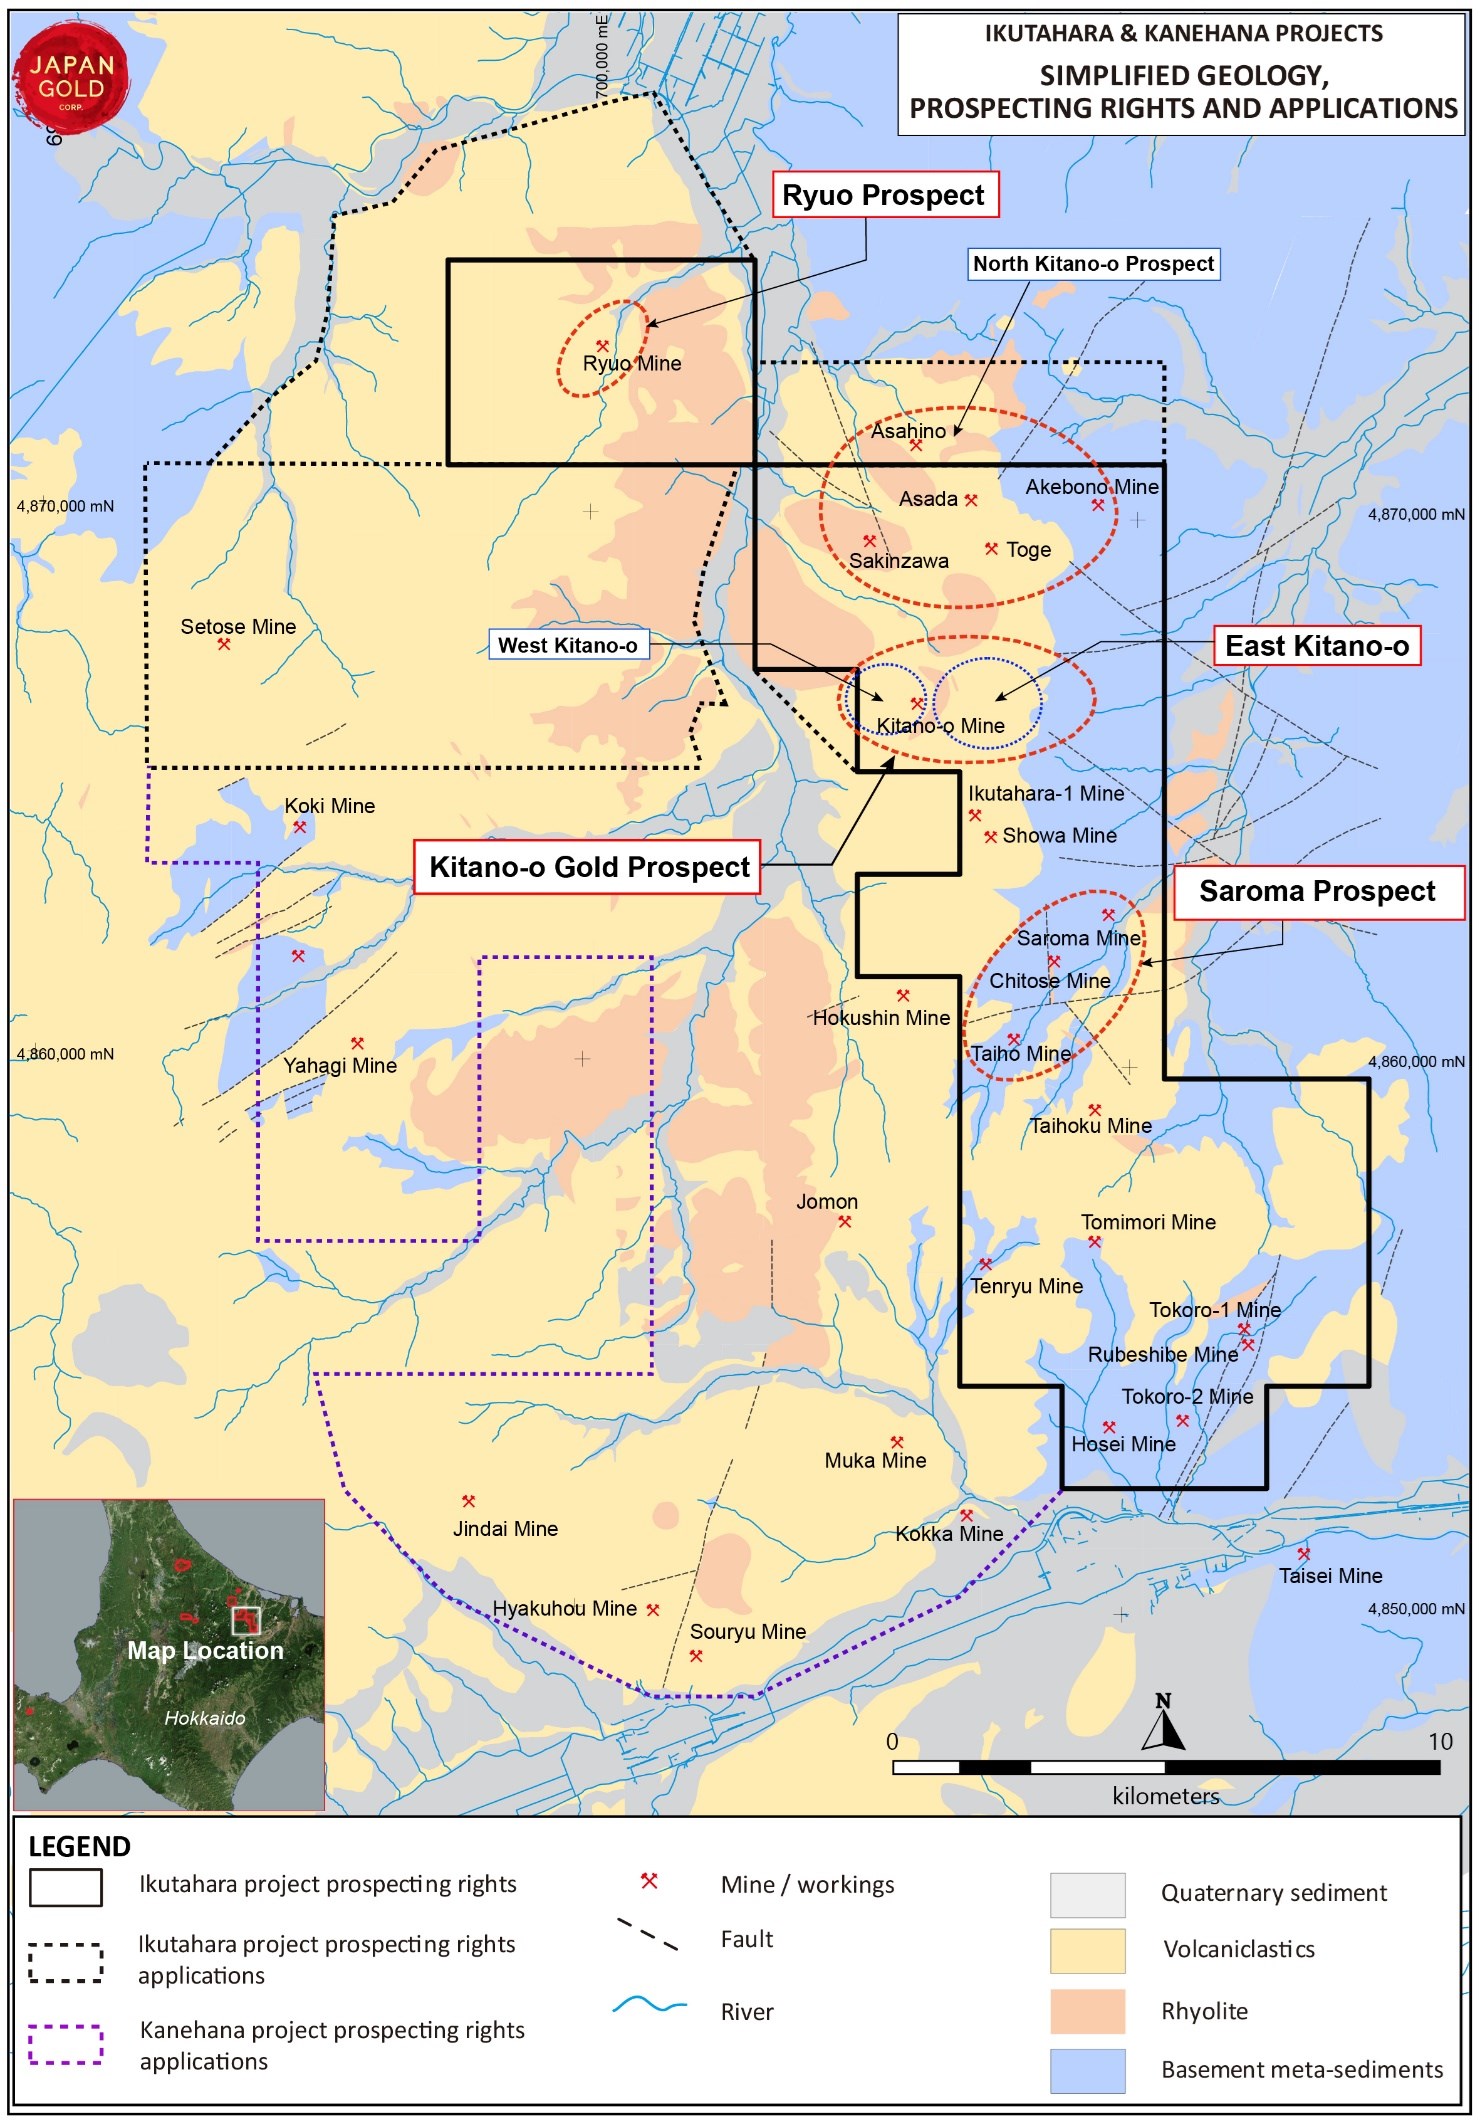
Figure 1: Ikutahara and Kanehana Projects with simplified geology, and historical mines and workings.
To view an enhanced version of this graphic, please visit:
images/news_releases/2022/december/147975_c60e5b4614abdae0_001full.jpg
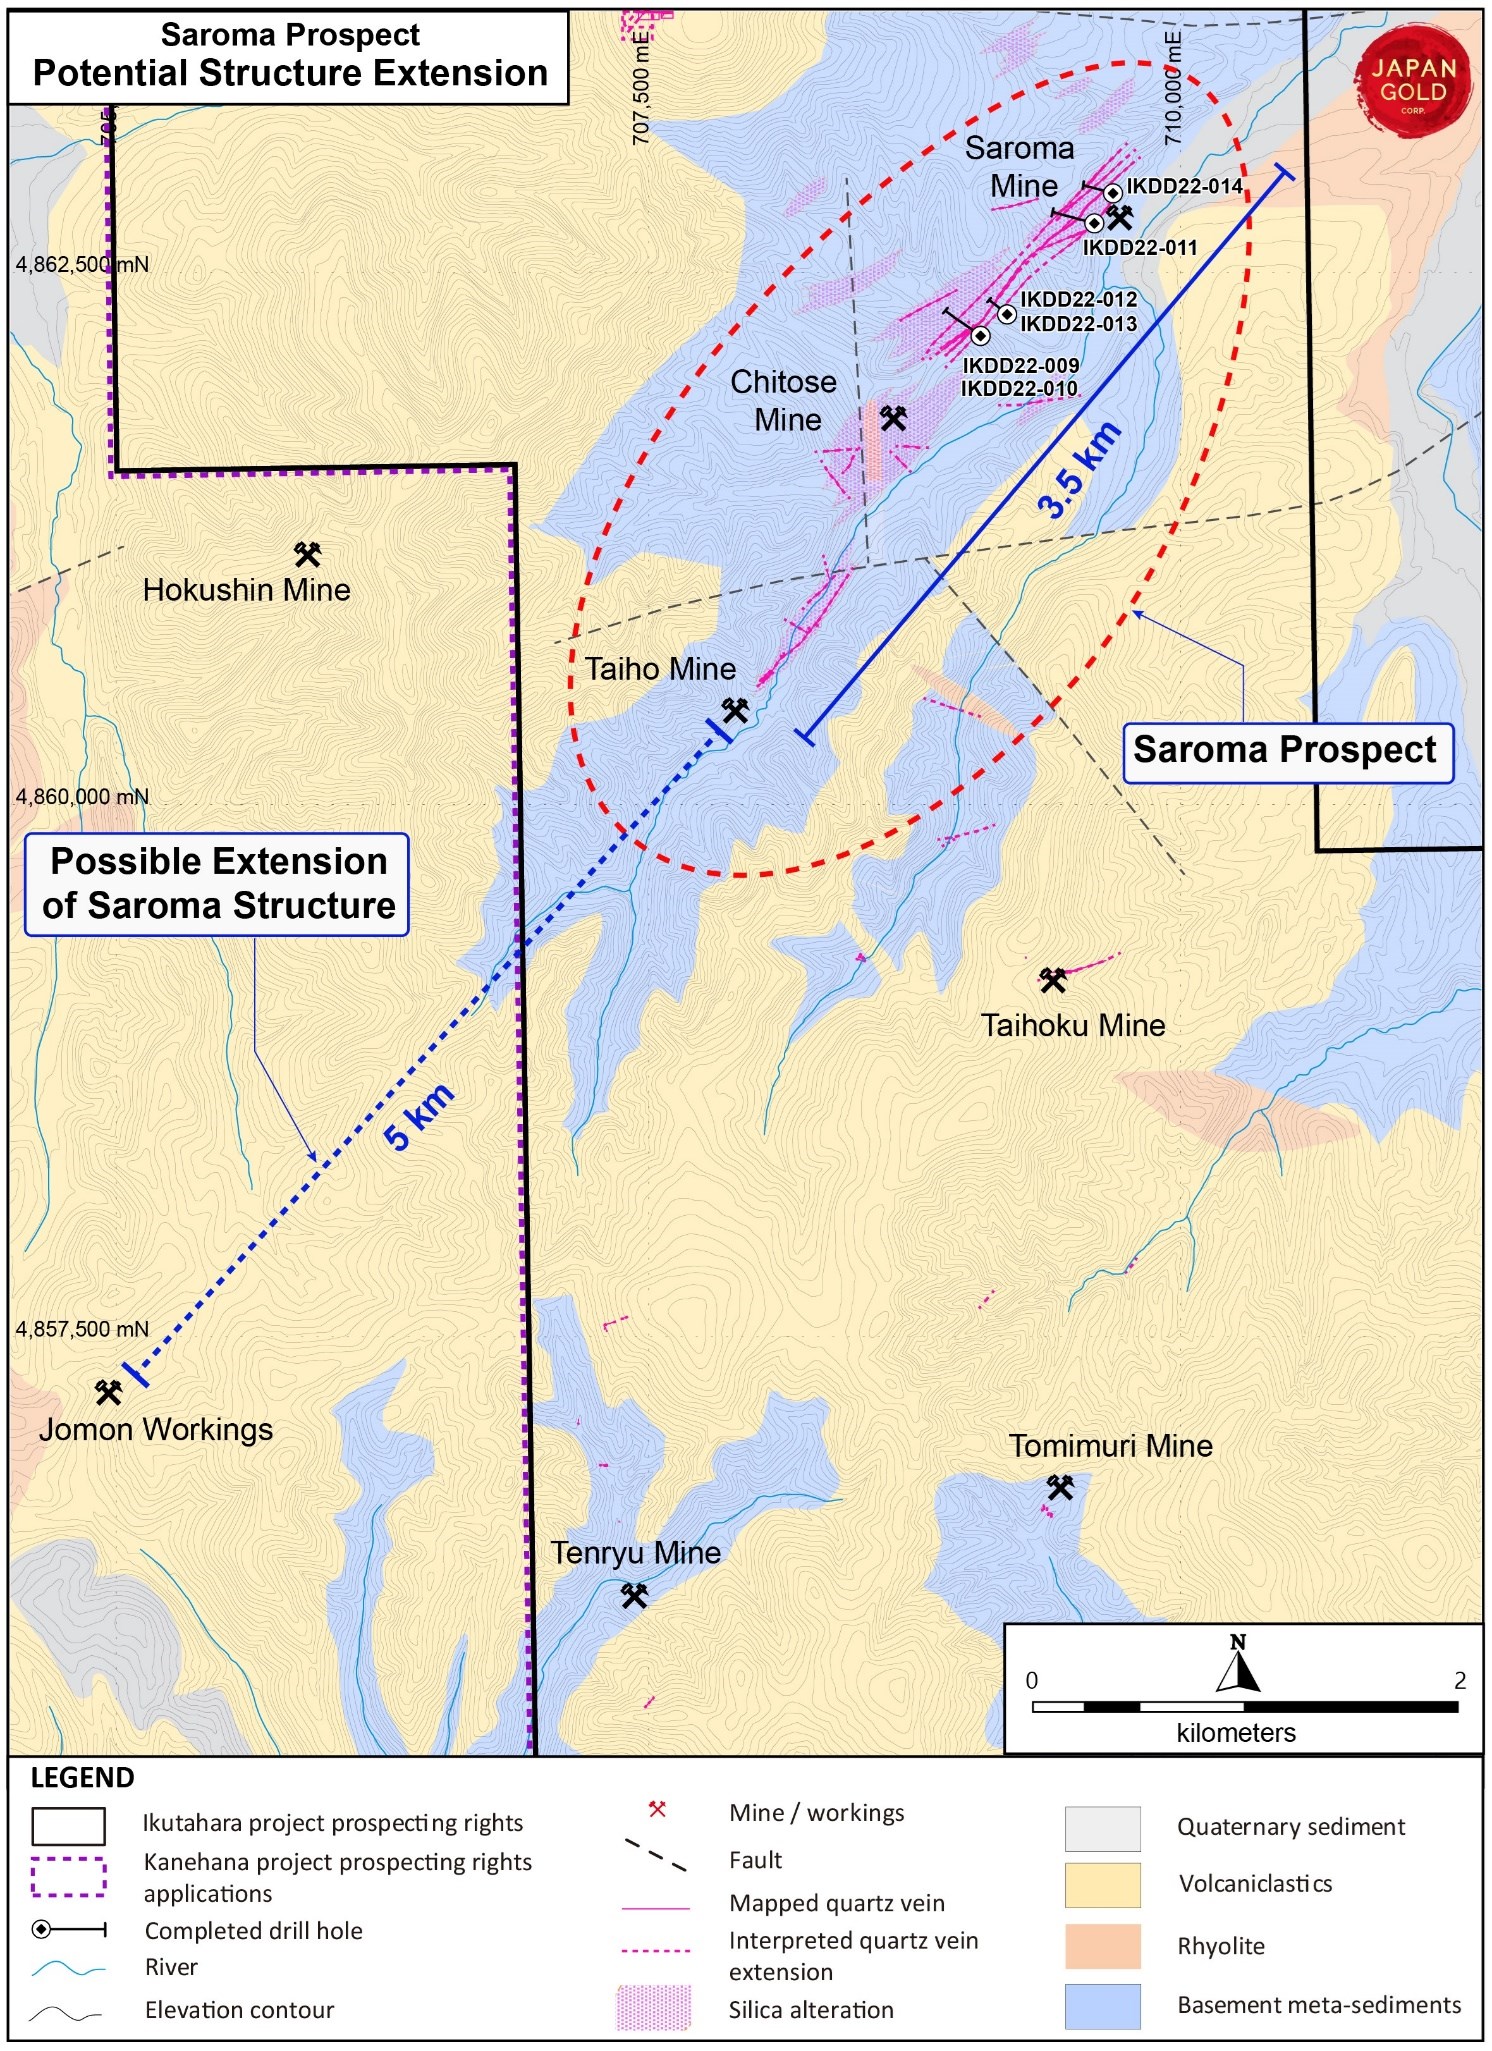
Figure 2: Saroma prospect showing area of drilling at the Saroma vein and potential extension of the Saroma structure southwest towards the Jomon workings.
To view an enhanced version of this graphic, please visit:
images/news_releases/2022/december/147975_c60e5b4614abdae0_002full.jpg
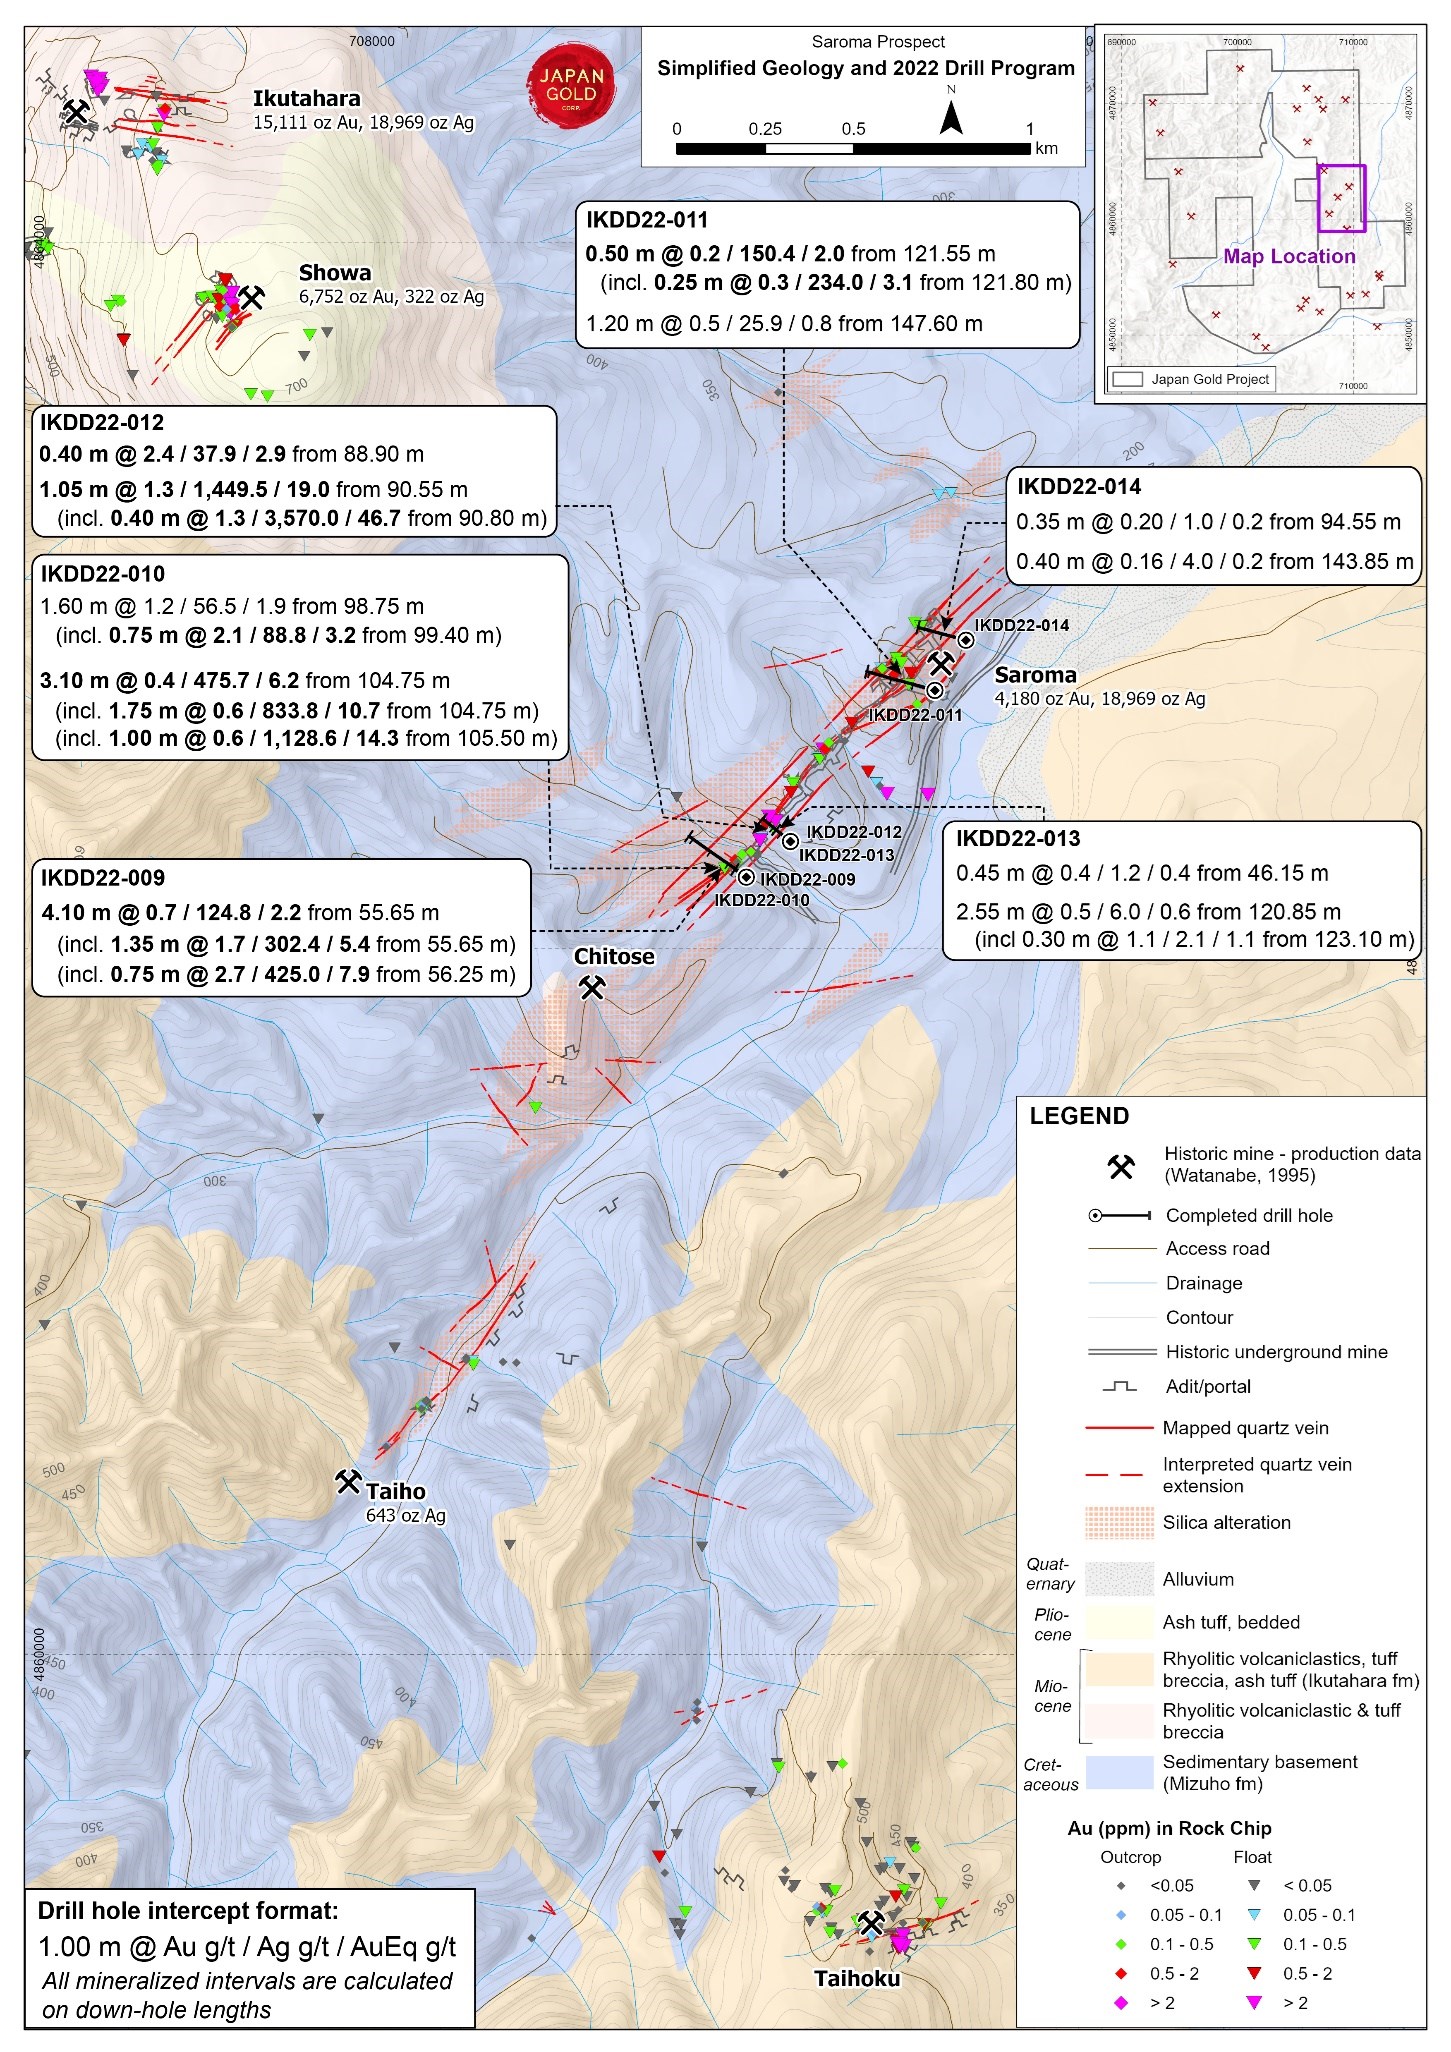
Figure 3: Saroma prospect, simplified geology, prospect locations and drill hole locations and significant intersections.
To view an enhanced version of this graphic, please visit:
images/news_releases/2022/december/147975_c60e5b4614abdae0_003full.jpg
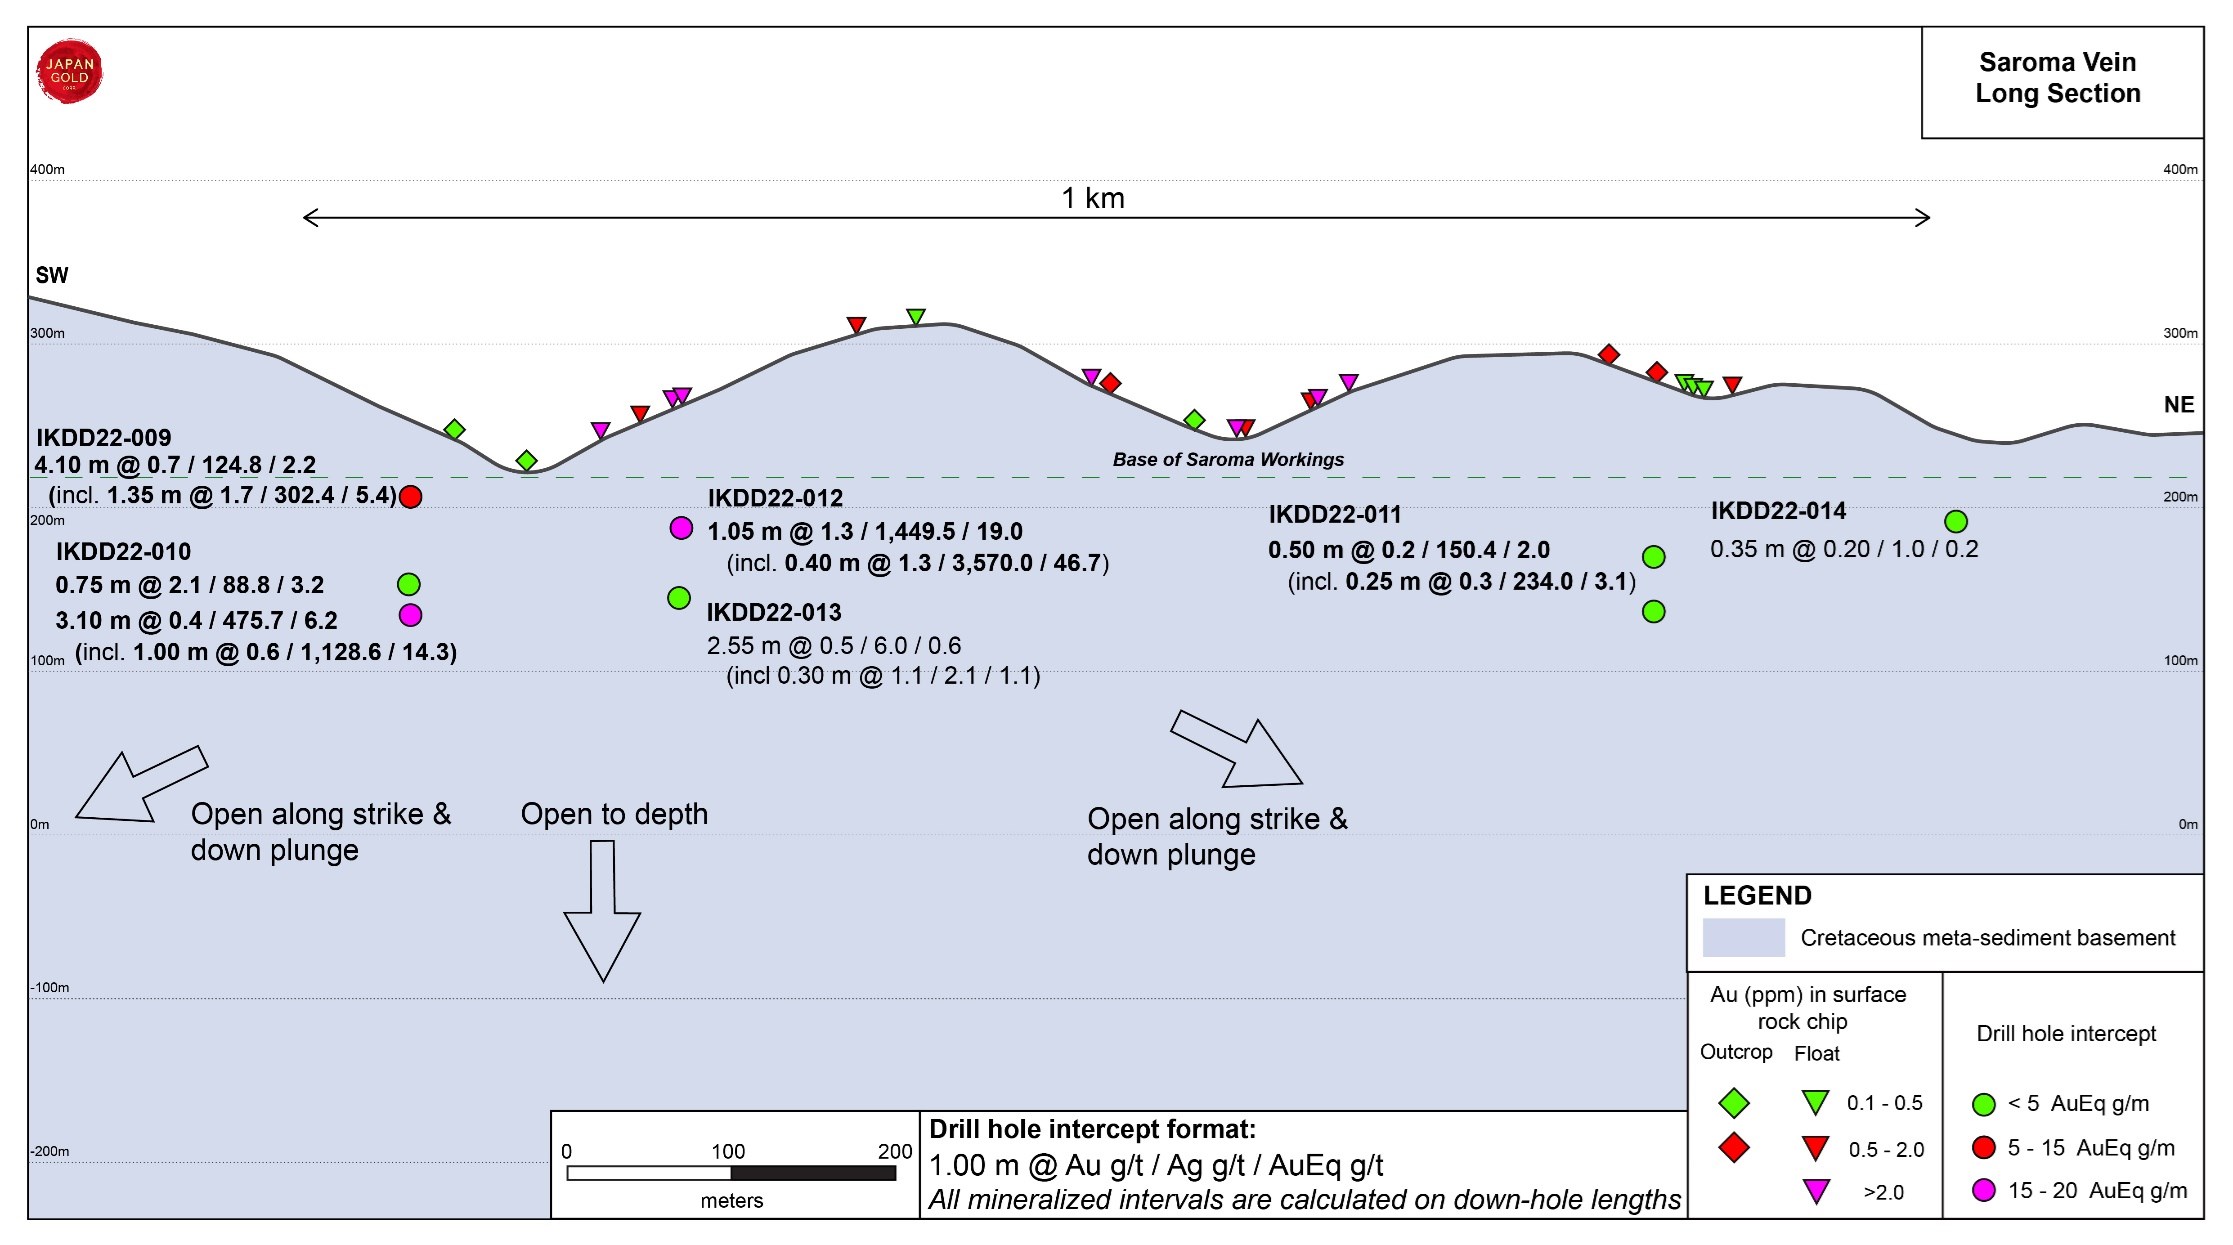
Figure 4: Saroma prospect: long section with mineralized intersections.
To view an enhanced version of this graphic, please visit:
images/news_releases/2022/december/147975_c60e5b4614abdae0_004full.jpg
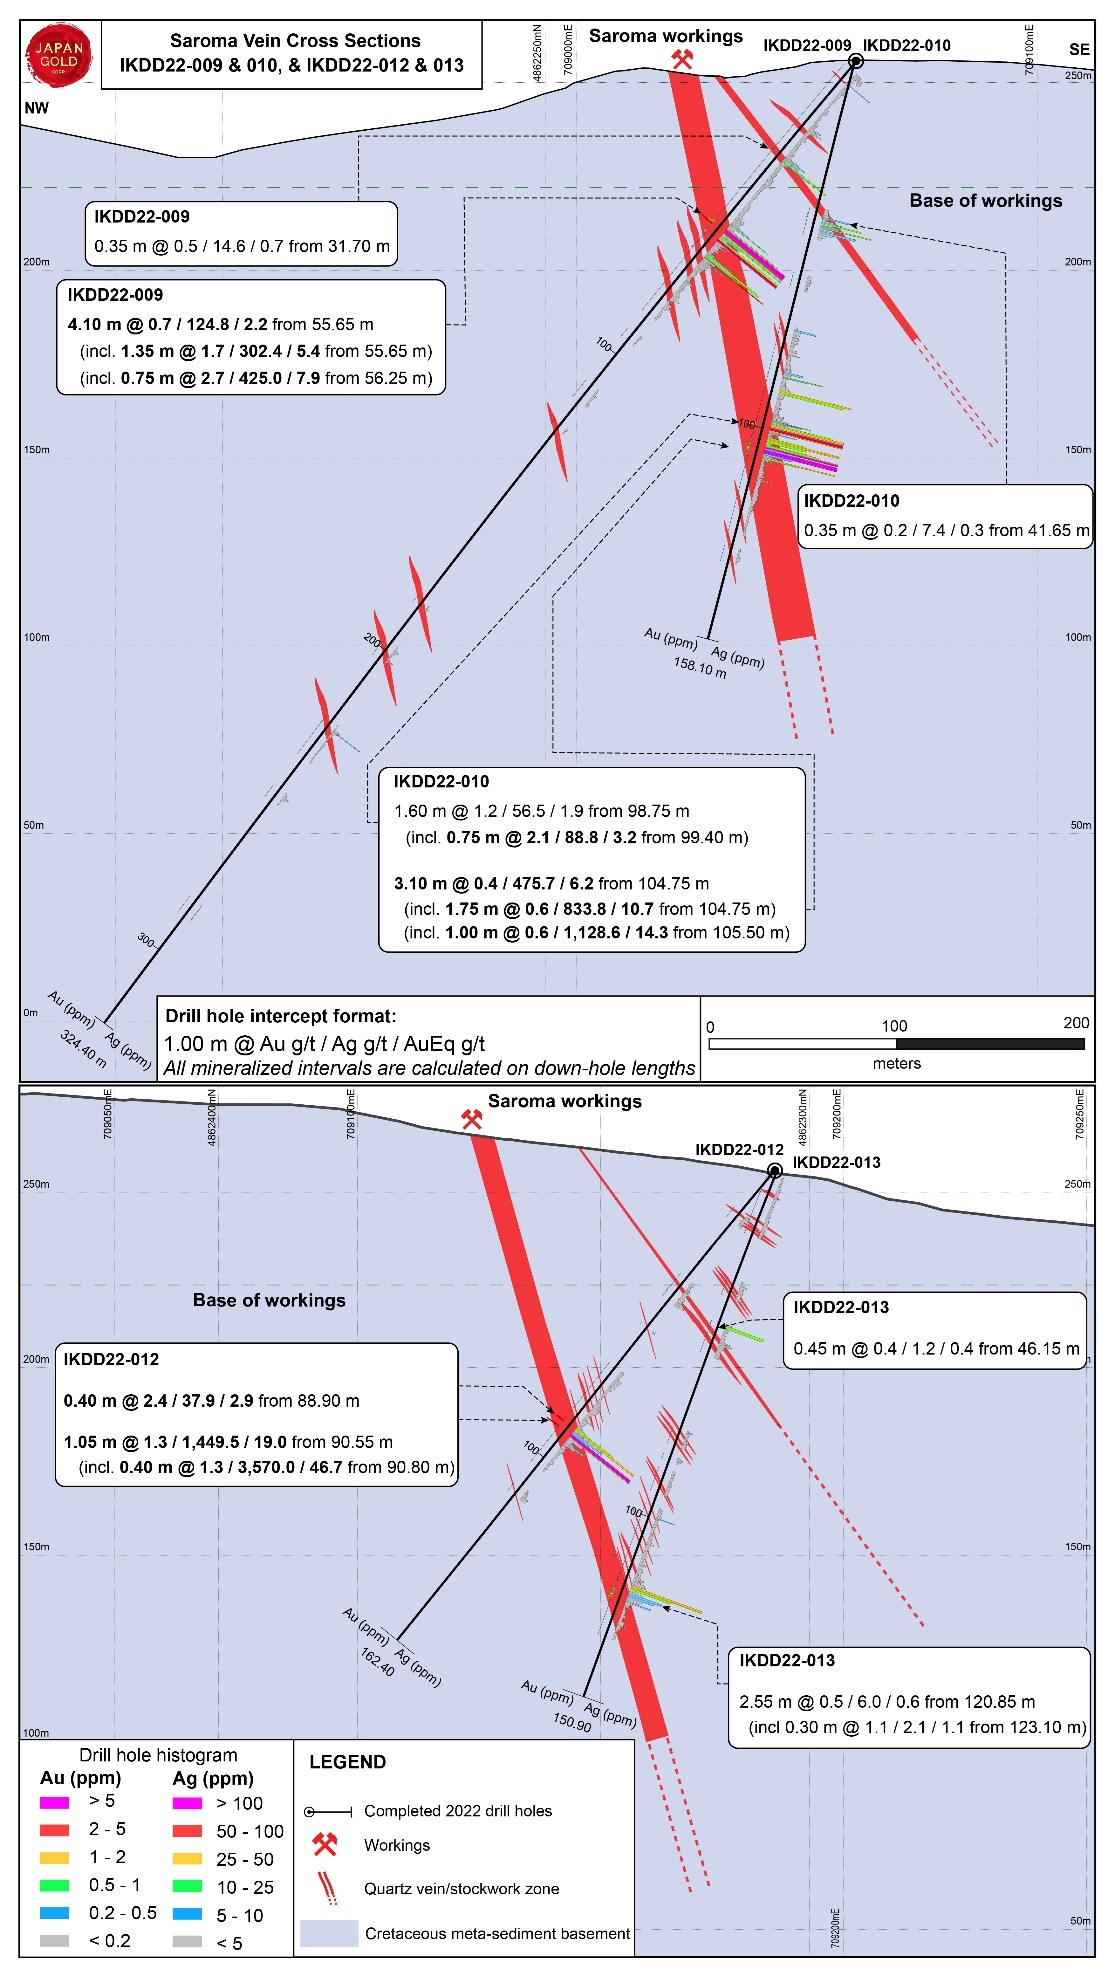
Figure 5: Saroma Mine: cross sections of drill holes IKDD22-009 & 010 and IKDD22-012 & 013 with mineralized vein intercepts.
To view an enhanced version of this graphic, please visit:
images/news_releases/2022/december/147975_c60e5b4614abdae0_005full.jpg
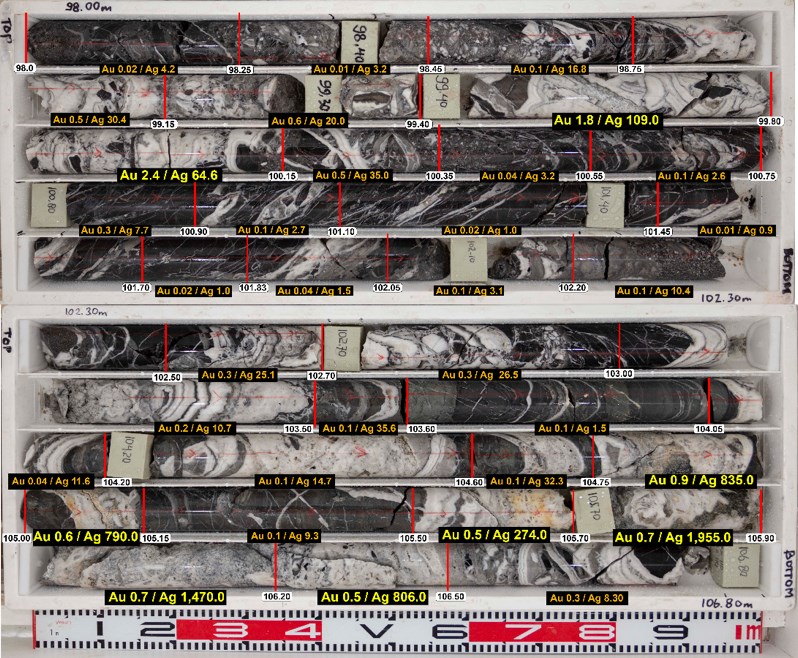
Figure 6a: Quartz vein intersection from IKDD22-010 with mineralized intervals
view an enhanced version of this graphic, please visit:
images/news_releases/2022/december/147975_c60e5b4614abdae0_006full.jpg
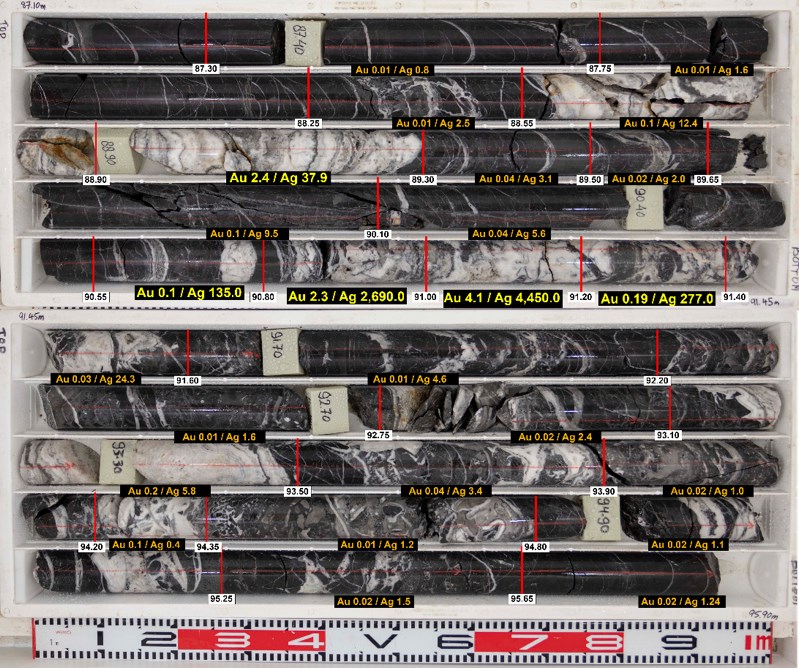
Figure 6b: Quartz vein intersection from IKDD22-012 with mineralized intervals
view an enhanced version of this graphic, please visit:
images/news_releases/2022/december/147975_c60e5b4614abdae0_007full.jpg
![]()
To view the source version of this press release, please visit https://www.newsfilecorp.com/release/147975